6.2 President's Quiz Reflections
1. Describe the significance of the global variable index. How was it used in this app? Based on your answer, why might indexing be important in programming?
The global index variable is important because it keeps makes sure everything is linked with other lists. The question in the second spot of the list is connected to the answer in the second spot of another list through indexing. Indexing is a good way to keep multiple items from multiple lists connected to corresponding items from other lists.
2. Using what you have learned about lists and indexing, how might you enhance this app so that it is a multiple choice quiz?
You would make multiple buttons for answers, and only have one of them match the index of the question (therefore it would be correct).
6.4 Big Data Reflections
1. Choose one of the data sets listed above in the Activity section and give a brief description of it. What specifically were the types of data (text, sounds, transactions, etc.) included in the data set you chose?
I looked at the Growth of the Internet data set. It featured a timeline that displayed the amount of Internet traffic from the 1990s to 2011. The timeline shows the exponential growth of data on the Internet and Internet traffic.
2. What new facts did you learn when exploring the data set? List at least 3 facts.
I learned that the number of global internet users rose from 100 million in 1996 to 2.27 billion in 2011,that global Internet traffic rose from 1 petabyte per month in 1995 to 27,483 petabytes per month in 2011, and that Big Data requires special software and hardware to handle.
3. Write a question you have about the data set you chose. Now, convert that question into a hypothesis (a statement) with your prediction about the data. (Hypotheses take the form of "If __________, then _________."
If Internet traffic continues to increase at an exponential rate, then more storage will be needed and more servers and workers will be needed to analyze these big data sets.
4. Identify at least one security and/or privacy concern that is associated with the data in the data set you chose?
One privacy concern is that companies can track you through the Internet and through credit card records to find out what types of products interest you, which could be concerning to people.
5. If your data set included a visualization, explain the purpose of the visualization. How would you change or improve the visualization? If it did not include a visualization, describe one that you think would be useful in understanding the data.
The data set I viewed was a line graph and showed to growth of the Internet and traffic over time.
6.5 Abstracting Data to the Web Reflections
1. Describe and give an example of the difference between synchronous and asynchronous data access.
Synchronous data is data that is stored on a device and is accessed immediately. Asynchronous data is data that is stored on the Internet and cannot be accessed immediately. Photos stored on you phone are synchronous while photos stored on the Cloud are asynchronous.
2. True or False. When an app retrieves data from Firebase, it first requests the data and then it stops whatever it is doing and waits for the data to arrive. Explain.
True, the app stops because it is asynchronous and must retrieve the data to continue working.
3. One aspect of abstraction is that it helps to reduce details to focus on what's relevant. How does the use of an external database in this app help reduce detail in the program?
It reduces the use of items in a list and it allows you to just call the items and change them much more easily.
6.6 Lists of Lists Reflections
1. Describe how using a list of lists allowed the Presidents Quiz app to have more variety.
Using lists of lists allows the President's quiz app to become a multiple choice quiz and eliminate any issues with spelling since the answers are already given to you. It also gives you a chance to at least take a lucky guess.
Using lists of lists allows the President's quiz app to become a multiple choice quiz and eliminate any issues with spelling since the answers are already given to you. It also gives you a chance to at least take a lucky guess.
6.7 Visualizing Data with Fusion Tables Reflections
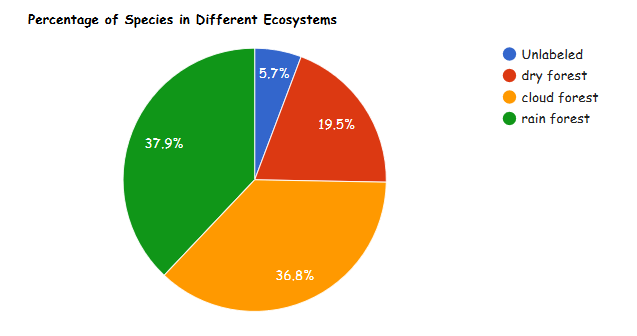
1. By filtering and analyzing your data set, create a pie chart that displays the relative percentages of cloud forest, rain forest, and dry forest specimens that occur in the data set. Describe the procedure you used to create the pie chart and copy and paste the chart into your portfolio page. Having troubles working with your chart?
The procedure I used to create my pie chart consisted of following a tutorial to get the data into a fusion table, making the data into a pie chart, changing the category to "primary eco", changing the value to count of primary eco, and sorting by count.
The procedure I used to create my pie chart consisted of following a tutorial to get the data into a fusion table, making the data into a pie chart, changing the category to "primary eco", changing the value to count of primary eco, and sorting by count.